Lexcube: Interactive Visualization and Exploration of High-Resolution Remote Sensing and Socioeconomic Data Sets
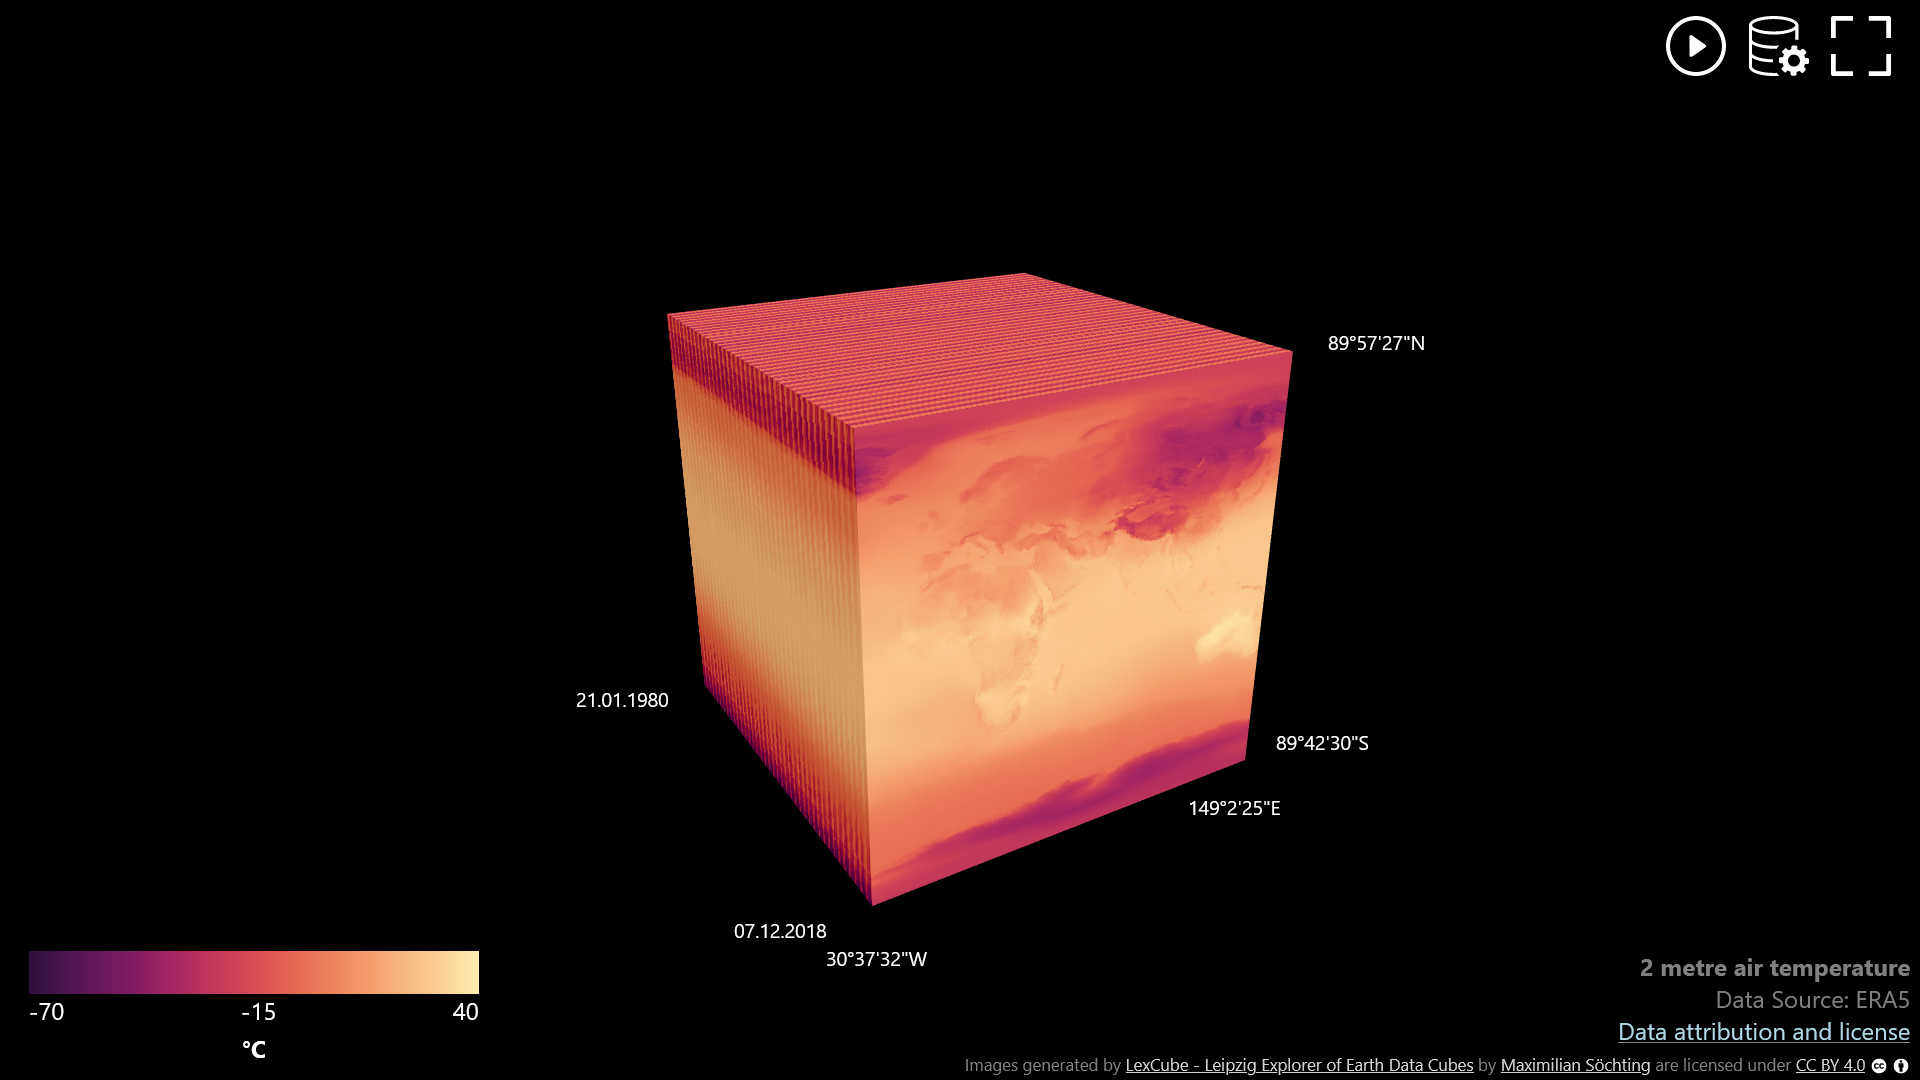
A multitude of data streams, such as gridded climate data and biophysical parameters of land and water bodies, are utilized for monitoring various subsystems of the Earth in space and time. As sensor technology advances, the spatial and temporal resolution of these data sets continue to increase, posing a challenge in obtaining global and local insights from the data. In order to explore these large socioeconomic and multivariate remote sensing data cubes effectively, we explored different visualization approaches and extended our existing client-server software architecture Lexcube (Media 1) for interactive exploration and visualization of data cubes. As part of this NFDI4Earth pilot project, Lexcube has been successfully released as open-access at lexcube.org. Furthermore, new features such as animations and axis labels have been developed and a new data set from the European Centre for Medium-Range Weather Forecasts (ECMWF) has been added since the public release. Lexcube.org has seen over 2800 users and 163,000 API requests since its public release in May 2022, offering interactive visualizations for open-access to a widely interested audience. In the future, Lexcube will be extended with additional functionality, including integration into data science workflows like Jupyter notebooks, and the ability to visualize multiple cubes simultaneously. Additionally, we are aiming to open-source Lexcube in 2023, which will enable a broader audience to benefit from Lexcube's capabilities and potentially contribute to its future development.

Resources
- Project website and interactive visualization
- Pilot report (Zenodo)